Embed code not available
from Twitter https://twitter.com/simonsays452
Embed code not available
from Twitter https://twitter.com/simonsays452
Embed code not available
from Twitter https://twitter.com/simonsays452
Embed code not available
from Twitter https://twitter.com/simonsays452
Embed code not available
from Twitter https://twitter.com/simonsays452
Embed code not available
from Twitter https://twitter.com/simonsays452
I like biotech stocks because of their asymmetrical risk and volatility.
$SRPT – Biotech maker of, among other things, an experimental treatment for Duchenne Muscular Dystrophy (DMD). In short, a frameshift mutation on the X chromosome causes the disease, characterized by muscle degeneration and premature death in boys, usually before their 25th birthday.
SRPT’s treatment, Eteplirsen, triggers excision of exon 51 during pre-mRNA splicing of the dystrophin RNA transcript. Skipping exon 51 changes the downstream reading frame of dystrophin. For DMD patients with this particular frameshifting mutation, Eteplirsen can restore the reading frame of the dystrophin mRNA, which has been shown to activate life-saving production of functional dystrophin.
The company has its fair share of hair:
But it does have promise:
As we approach the January meeting date, I’ve opened some speculative $40 calls.
I’ve discussed the technicals HERE
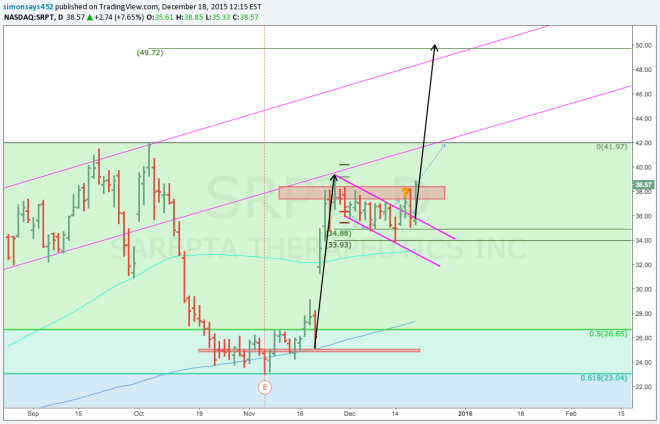
Again, I like biotech stocks because of their asymmetrical risk, and volatility, which $SRPT has had plenty of! Since entering its long term channel in June 2015, intraday volatility (high/low) has averaged 6.2%, each day.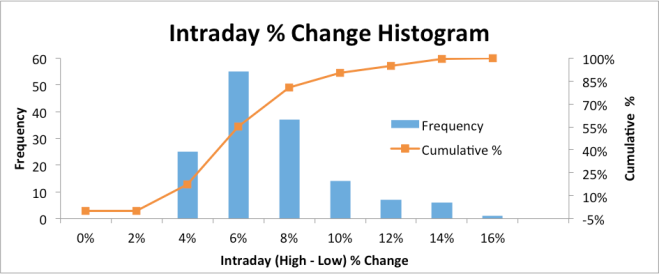 I’m long the stock on a fundamental basis going into the January ADCOM meeting and I expect the stock to trend higher on optimism into the meeting date. As such, I want to maintain a net long exposure, but given the volatility, I’d also like to harvest gains from outsized moves. I performed a small quant analysis to try to optimize a trading strategy for trading calls from the long side. I focused on outsized daily moves and gaps and their following day follow throughs.
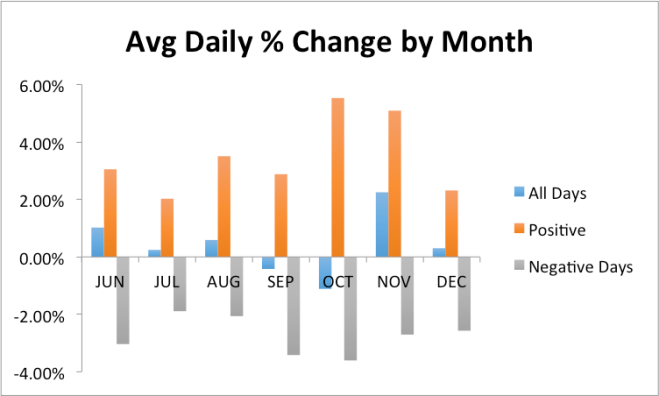
Daily (Close-Open) % Change
Daily Follow-Through Gains
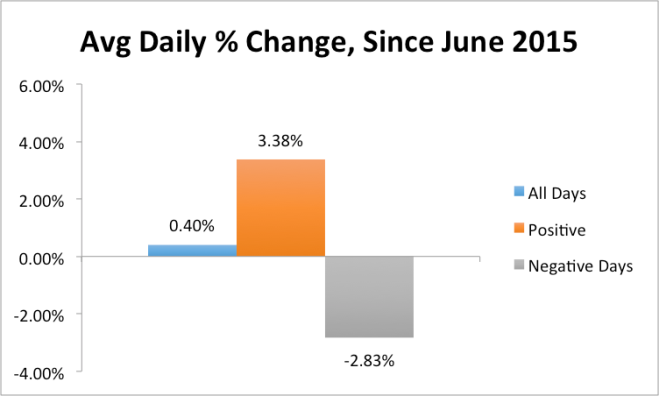
Here, I test the momentum hypothesis that outsized daily positive moves (high-low) should precede further next day positive gains. Essentially, if you’re long after a big move higher, don’t sell, continue to hold.
Days with greater than average positive daily moves (> 3.38%) saw a positive next day “follow-through” 61% of the time, with a median gain of 0.53%, but an average next day decline of 0.12%. Too weak to warrant a specific strategy.
Next Day High Follow-Through Gains
If large moves from open to close don’t precede “follow-on” gains, maybe moves that extend overnight do? “Next Day High” gains are measured from the prior day’s close to the current day’s high. Above average “Next Day High” gains (> 3.54%) saw new highs made during the next day 94% of the time, with a median follow-through gain of 2.22% and an average follow-through gain of 3.10%.
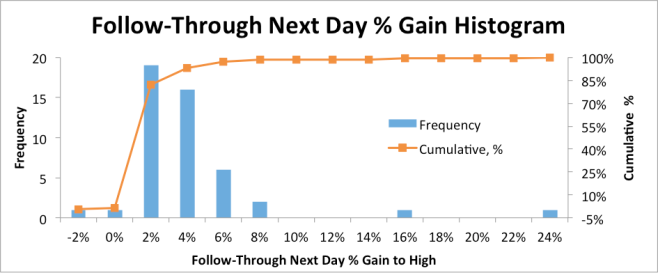
This data suggests that if you’re long after a large overnight move, you definitely should not take profits until a new high, roughly 2.5% higher is set, the next day. Moreover, 60% of the time another, third, new high was set two days after the initial close. That said, this new high was only a median of 0.54% and an average of 0.68% higher than the prior high. This suggests that the first new high after an above average “Next Day High” marks a reliable price level to target an exit over the next trading day.
As predicted, yesterday, HERE, I suggested that Yellen would (1) hike 25bps, (2) she would assure markets that no schedule for subsequent hikes exists, but more importantly, (3) she would be less dovish than the market expected.
A range of recent labor market indicators, including ongoing job gains and declining unemployment, shows further improvement and confirms that underutilization of labor resources has diminished appreciably since early this year.
The above sentence is the most important in the statement, my emphasis. Regarding labor market slack, here’s the evolution of the Fed’s view on labor market slack in 2015, statement by statement:
January
On balance, a range of labor market indicators suggests that underutilization of labor resources continues to diminish.
March
A range of labor market indicators suggests that underutilization of labor resources continues to diminish.
April
A range of labor market indicators suggests that underutilization of labor resources was little changed.
June
On balance, a range of labor market indicators suggests that underutilization of labor resources diminished somewhat.
July
On balance, a range of labor market indicators suggests that underutilization of labor resources has diminished since early this year.
September
On balance, labor market indicators show that underutilization of labor resources has diminished since early this year.
October
The pace of job gains slowed and the unemployment rate held steady. Nonetheless, labor market indicators, on balance, show that underutilization of labor resources has diminished since early this year.
Appreciably tells us the Fed has just accepted that it’s employment mandate has been met. Late, per usual. In reality, the Fed’s employment mandate was reached, long ago. It still has some wiggle room on the price stability front, but not much.
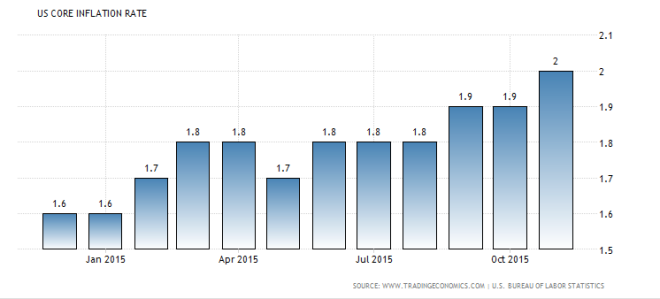
Core is running at 2% and I don’t buy that Core adequately excludes the entirety of changes in oil prices. Transportation costs filter into goods prices beyond just the standalone transportation line item. Moreover, as I’ve mentioned before, HERE, I believe the market is underestimating the impact of the soon to be realized base-effect of oil declines in CPI calculations.
In short: CPI is a year-over-year calculation. Oil began its halving in Nov/Dec of 2014. Beginning in Q1 2016, CPI will use Jan/Feb/Mar 2015 oil prices to determine inflation rates. 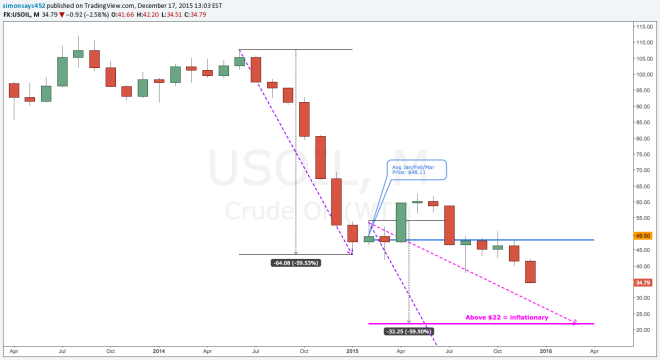 As shown above, the pace of oil declines in 2014 (purple dashed line) was infinitely sharper than the pace in 2015 (pink dashed line). As such, when the effects of oil’s 2014 declines are removed, anything above ~$22 will be inflationary vs the prior year trend. While I actually believe $20 something oil is quite possible, such a move would not necessarily be disinflationary vs 2014’s decline. Simply put, in reality, oil prices above $20 should be inflationary, moving forward. With core running at 2% in November, there’s a very real risk that inflation leaps higher, and very quickly so.
So what do you do next? Buy stocks, and buy the dollar. Yes, it’s boring, but it’s what has worked and also what is likely to continue to work. The market is pricing in 3 hikes, the dot plot says 4. The only other real takeaway from the dot plot is the notable decline in 2016 dots, which might reveal a quid-pro-quo for moving slower in 2016 in exchange for the unanimity for initiating liftoff in December.
Will she or wont she? 81.4%, down just a touch from yesterday’s 83.3% say, ‘she will.’
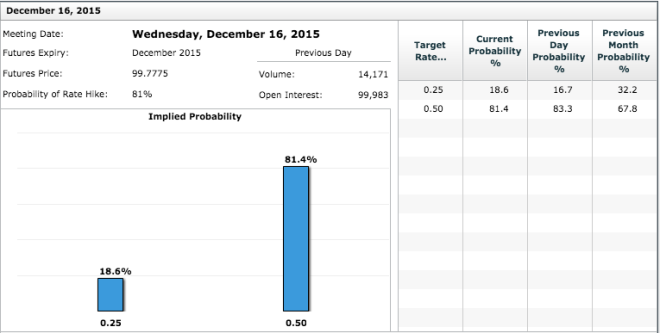
When conviction is super high, trades get crowded and markets get one-sided. Um, remember the 5+ sigma move in EUR/USD post Draghi’s disappointment, last week? One-sided markets offer great opportunities for asymmetrical risk.
Before we highlight potential asymmetrical risk trades, here’s what I expect to happen on Wednesday.
With the exception of my belief that she will be less dovish than the market expects, pretty much everything else is par for market expectations. That said, I do believe that the dot plot could rattle some algos and first movers. Um, remember Kocherlakota’s negative dot in September? I wouldn’t be surprised to see his 2017 dot fall below 1.00% and potentially his 2018 dot at or below 2.75%. Similarly, I think it’s equally likely to see some of the hawks’ dots move higher.
Given these expectations, where does asymmetrical risk exist?
Going into tomorrow’s FOMC decision, I see standalone asymmetrical risk in each of these assets if Janet goes with the 20% and doesn’t move.
Starting with the USD. Yes, longs got burned a la Draghi, but the market still sees global monetary policy divergence as a stedfast theme, albeit to a lesser degree. Dollar strength doesn’t lie with a single rate rise. Instead it relies on the expectation of subsequent rises following the commencement of lift-off. A surprise fold, would push lift-off another 6 months down the road, too far into the future for dollar-longs to finance the trade as vigorously.
Short USD is the first-level trade. Where can we find more beta? Maybe EURUSD? Equity markets expect a hike, and par for that expectation will be bullish for stocks = Short EUR and buy US stocks. Folding will firstly be fundamentally bullish for the EUR/USD cross and secondly bearish for equities, which will further strengthen EUR/USD due to carry trade unwinds. USDCHF? With the world’s lowest interest rates (-0.75%), it makes sense that if the Fed doesn’t move, you’ll see outsized strength in CHF. Combining the two, go long EUR/CHF.
On to Oil. Regardless of where you think oil should be trading – I can make a strong case for lower, it’s simply very oversold. We’ve seen oil characteristically, over-correct when RSI falls to ~20, which it did last Friday. Moreover, historically, we’ve seen buying into WTI futures options expirations 8 of the last 11 times – December crude options expire tomorrow.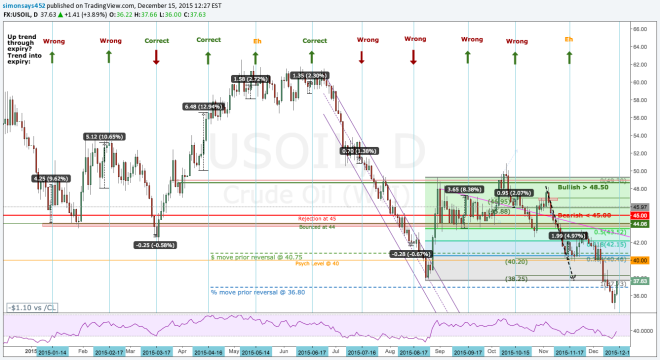
The last 5 over-corrections to the upside have averaged + 15.4%. From Friday’s lows, that takes us to $40. 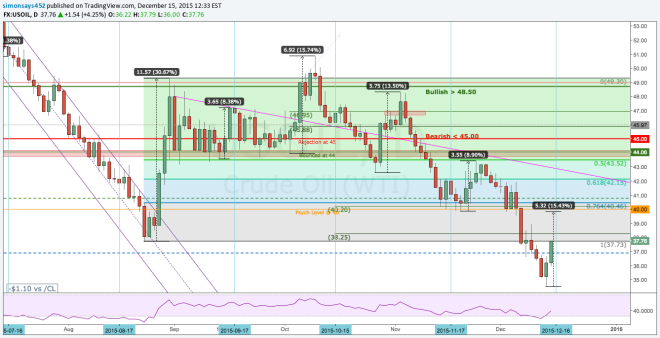
Last week, Bloomberg reported that open interest in the December $35 puts reached an all-time high. With all those options turning ITM on Monday, you can be assured, the $35 level will be hedged/frontrun away from, higher. Coupled w Fed that doesn’t move, and a weaker USD, Oil has plenty of room to way over-correct above $40.
Looking for higher beta on the oil trade? What about commodity currencies, CAD and AUD. I’m more familiar with trading CAD. It tracks oil prices very well and coupled with a weaker dollar, it could be a nice short.
Rounding it out with high yield. I have limited experience trading high-yield – I tried going long after the June ECB meeting, but nothing materialized. That said, the current hysteria that the world is falling apart courtesy of junk screams of an over-reaction. If the Fed doesn’t move, we’re expecting 6 more months of inaction. That’s plenty of time for rates to reverse lower and markets to be caught off-sides, again.
With so much high yield tied to oil prices, a strengthening in oil prices will sure up high yield NAVs and could lead to a short squeeze higher.
What I’m trading:
One final update on the Euro Futures trend analysis from last weekend. No important new take aways on the main analysis found here: https://simonsays452.wordpress.com/2015/11/10/update-euro-futures-price-action/.

The below graph charts when highs and lows occurred during each trading day in the month of October. Broadly speaking, highs were more frequently found between 7:45pm and 10:30pm as well as at 4:25am. Lows occurred most often between 5:00pm and 9:06pm and between Midnight and 2am. I think the most important take away is that highs did not occur between 1:17pm and 7:45pm. Similarly, only 2 lows were encountered between 10am and 5pm.
As promised, I updated my analysis of the Euro futures work I performed over the weekend to include a rolling analysis of price action changes. As discussed in my prior post: Euro Futures Analysis: October 2015, my original price action analysis only looked at the first and last trade of each hour, and ignored all other trades that took place within the hour. This new rolling analysis examines each trading minute’s hour-over-hour price change (close – open) for every trading day in October 2015.
This first chart averages each minute’s hour-over-hour price change for every trading day in October 2015 to model how the hour-over-hour price change shifts over the course of the trading day.
[The hour-over-hour price change for the 800 minute is calculated as the close at 800 – the open at 801. Remember, this graph depicts shifts between rates of change, not price levels. So areas shaded green represent periods of positive price changes, and red represents periods of negative price changes.]

Broader trends are more easily apparent in the hourly chart. [In the hourly chart, 800 on the X-axis corresponds to the average hour-over-hour price change for every minute during the eight o’clock hour (800 to 859).]
The pattern that emerges is closely in line with the results of my prior analyses. Broadly speaking:
 The takeaway from this analysis for a Euro bear is straightforward:
